Smart Sensor Systems is now introducing a new generation of web-based control panels, designed to give customers maximum flexibility and ease of use. “We have developed solutions that enable a tailored presentation of measurements, while significantly expanding the notification options,” says CEO Halvor Heiberg.
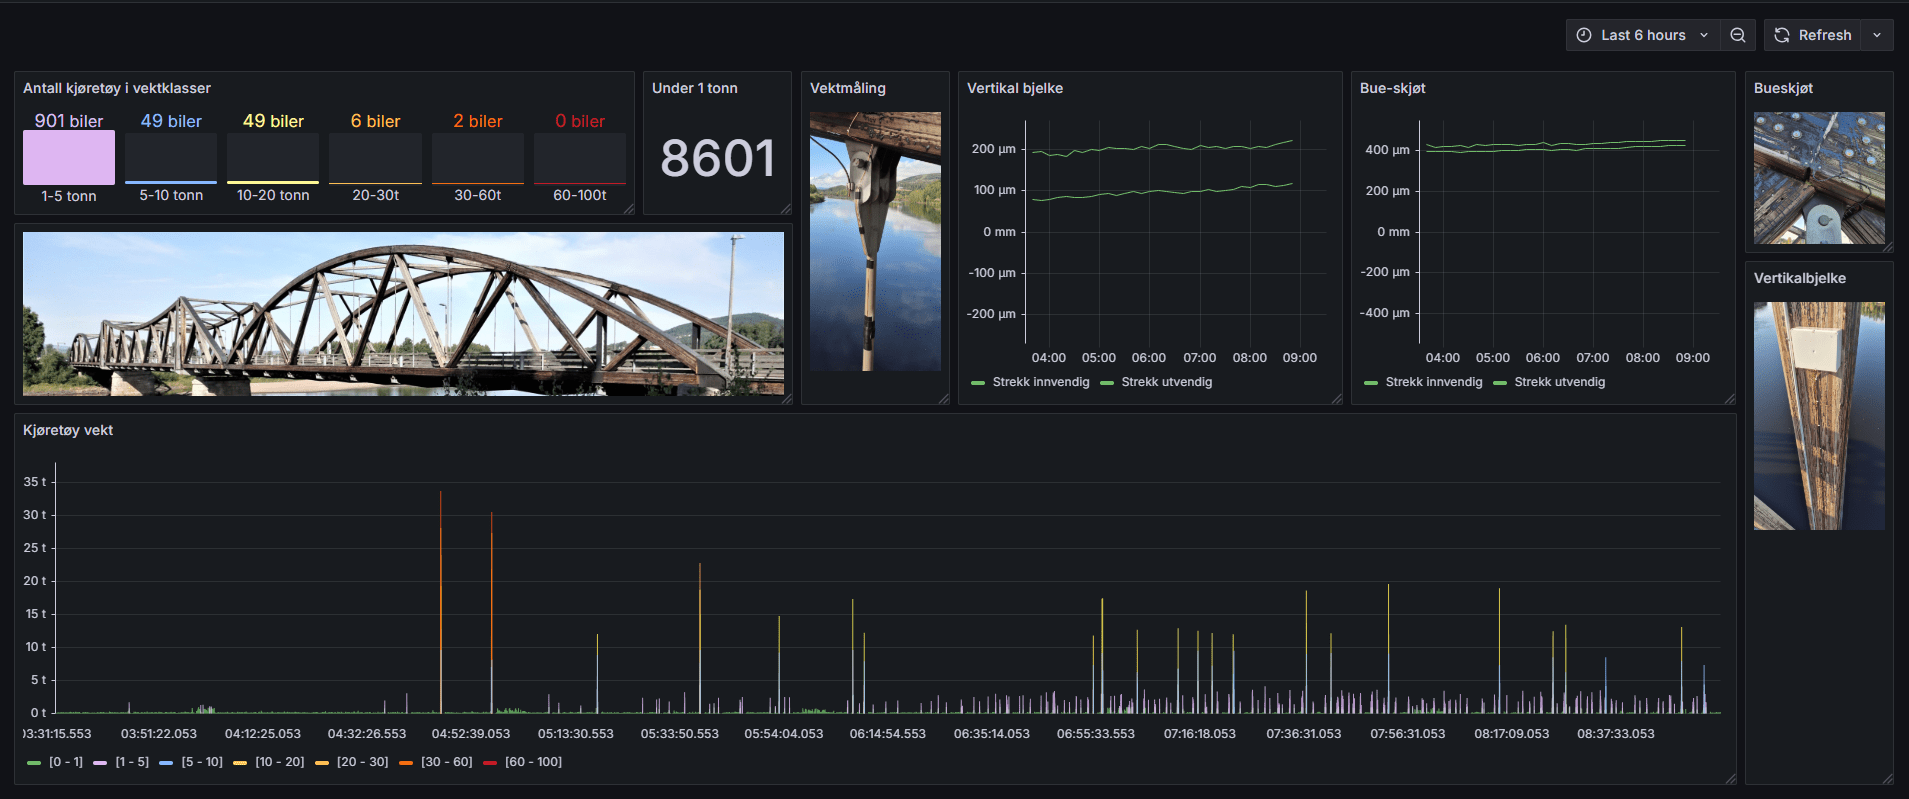
– The new control panel is designed to provide an intuitive and visual experience. Here we can integrate images, maps, video, measurements, graphs and diagrams in a wide range of formats. Our goal is to adapt the solution to each individual customer, so that they get an overview that is both informative and easy to navigate, explains product developer Joakim Hellum, who is responsible for the technical implementation.
To further improve the user experience, we have optimized navigation by reducing the number of buttons and replacing them with intuitive drop-down menus for filtering.
– This gives us the opportunity to deliver precise solutions that meet the customer's specific requirements, Hellum elaborates.
The new dashboard provides a detailed overview of data from each sensor connected to iBridge, our intelligent data-driven system. The values can be presented in various formats, including charts, graphs, images and text, depending on the customer’s preferences.
The first customers have already started using the new control panels, and the response has been positive.
“We have received a lot of positive feedback from customers, particularly highlighting the user-friendliness and customization options,” says Joakim Hellum. All customers will have migrated to this new solution by February.
Smart Sensor Systems already offers notification and alarm functions via SMS and email when sensor values exceed predefined limits. Now the functionality is expanded with even more options.
– With our new solution, customers can also receive notifications through popular communication platforms such as Google Chat and Microsoft Teams. This provides an extra dimension of flexibility, concludes Halvor Heiberg.
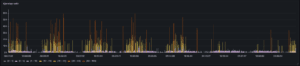
This is what a graph can easily look like when measuring bridge load over a seven-day period.